Drive results with custom reports & analytics
Transform your link management strategy with in-depth, real-time data and insights.
Trusted by 1.5M customers worldwide

Unlock actionable insights
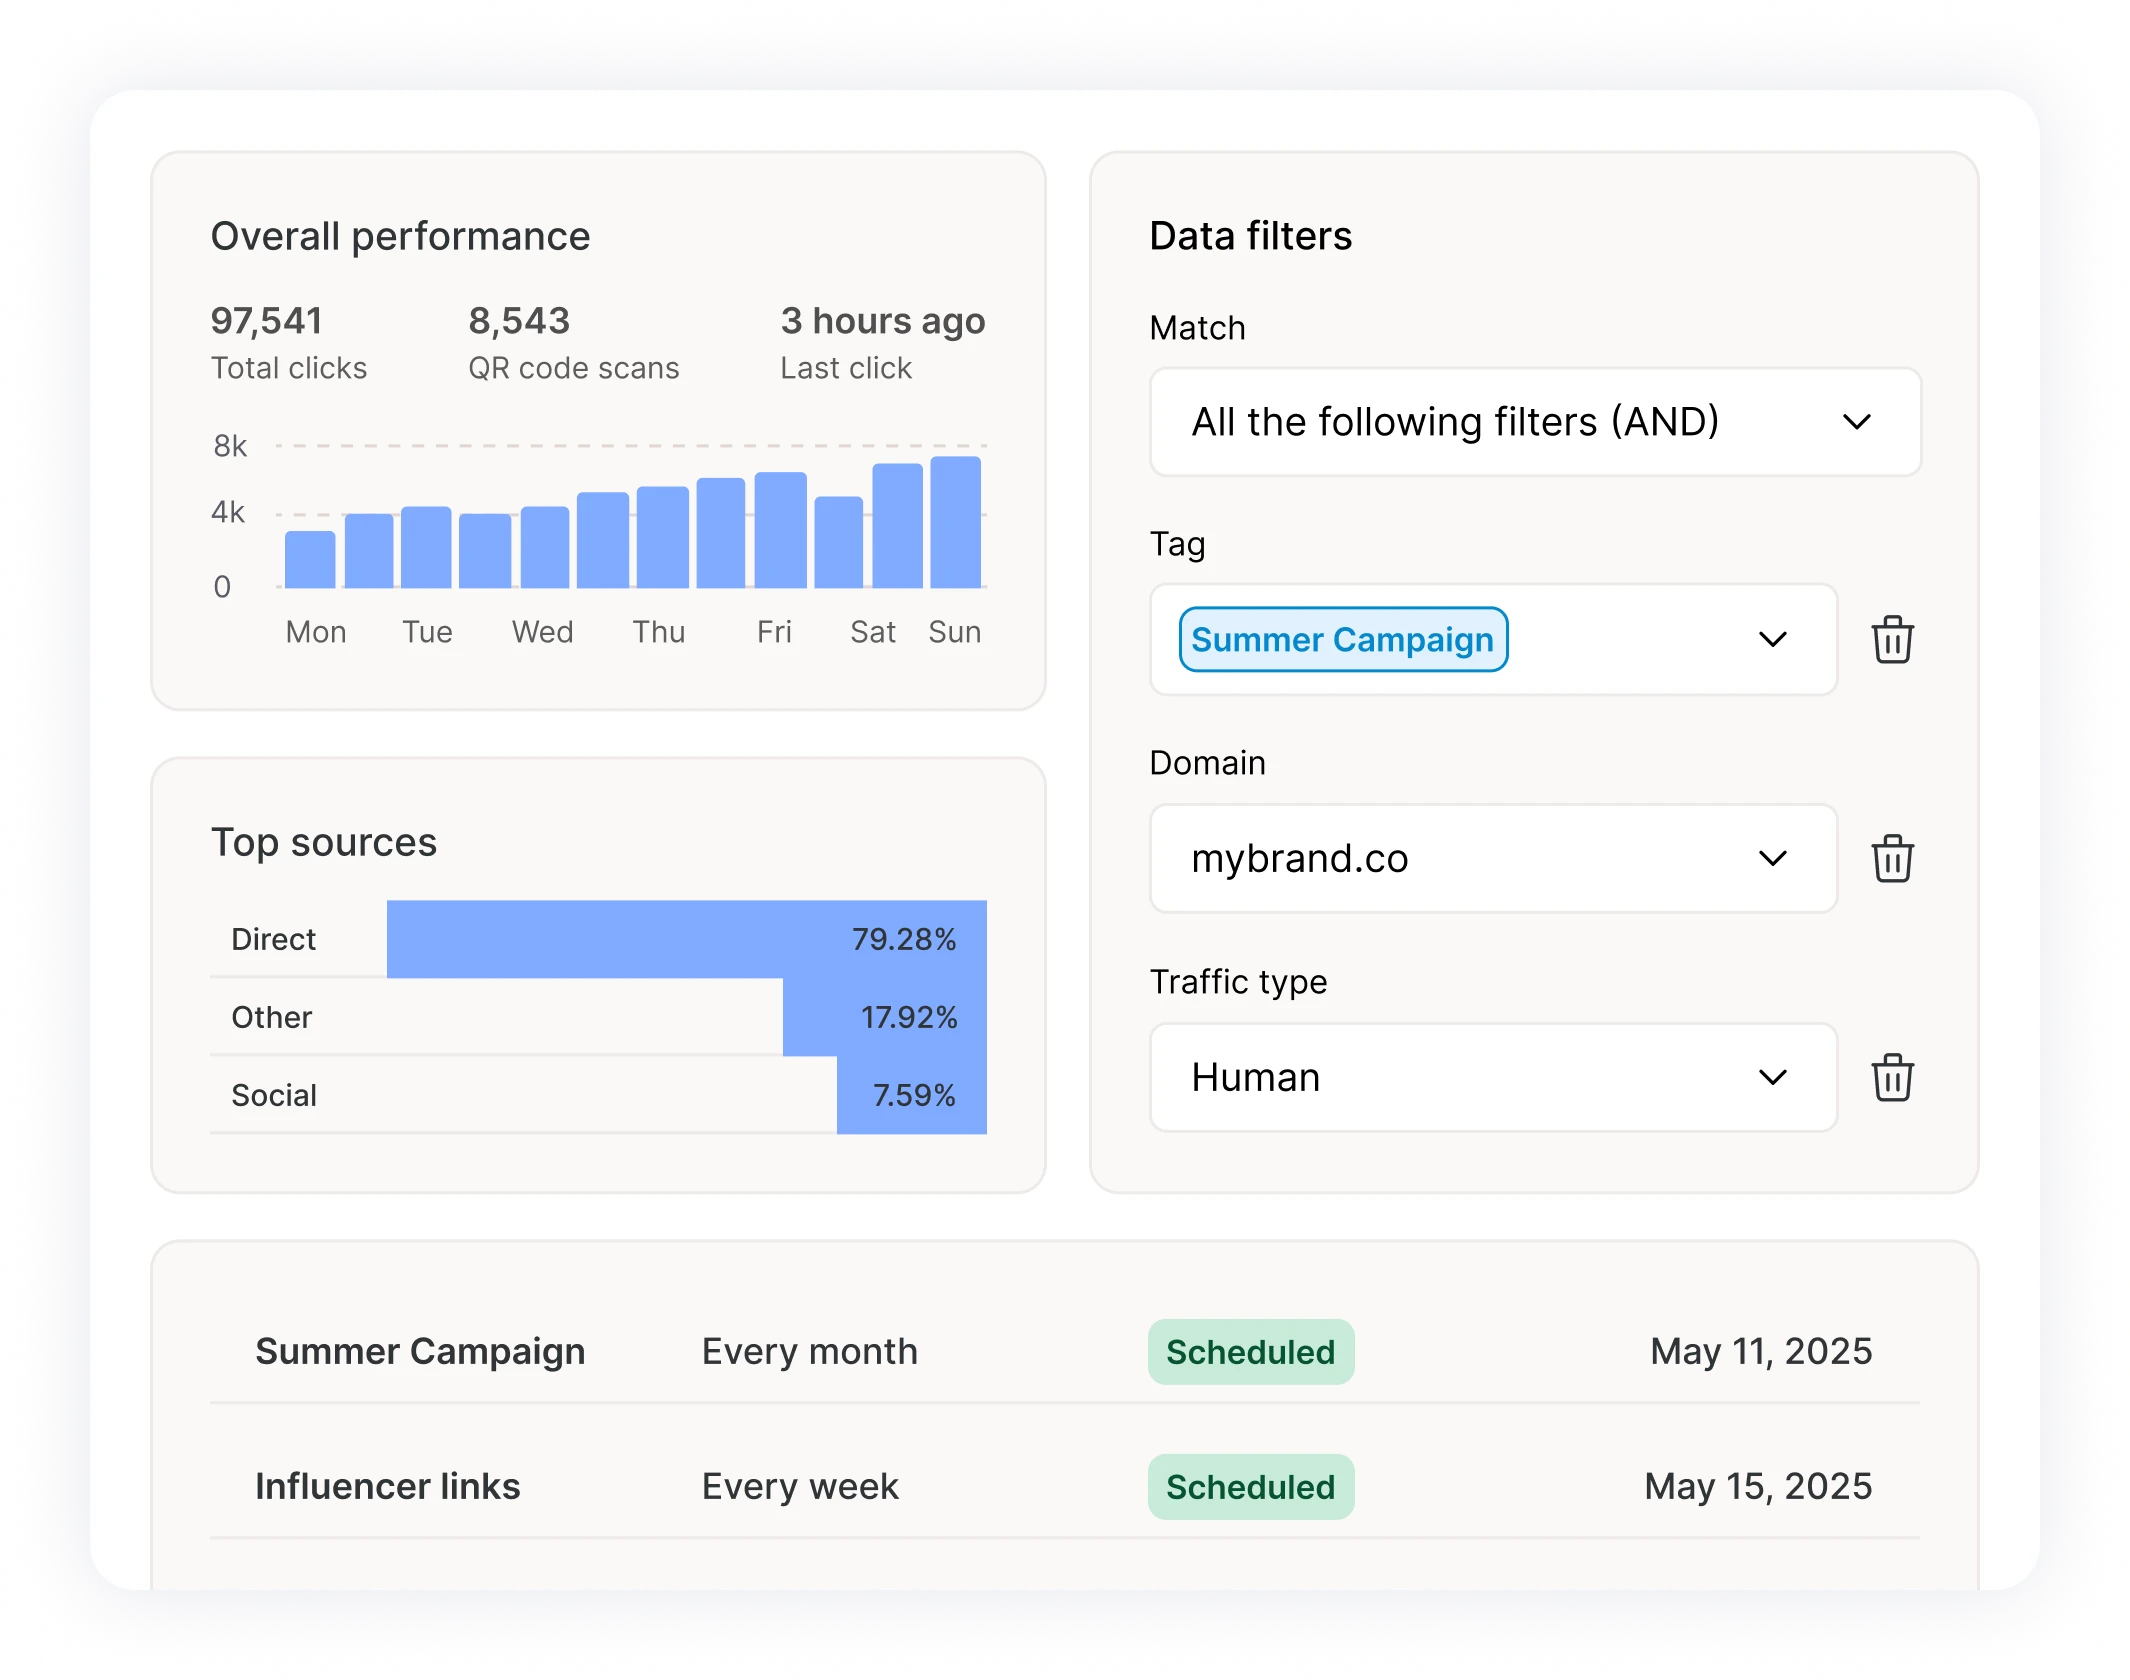
Capture click data across branded links and QR codes to make informed decisions about your campaigns.
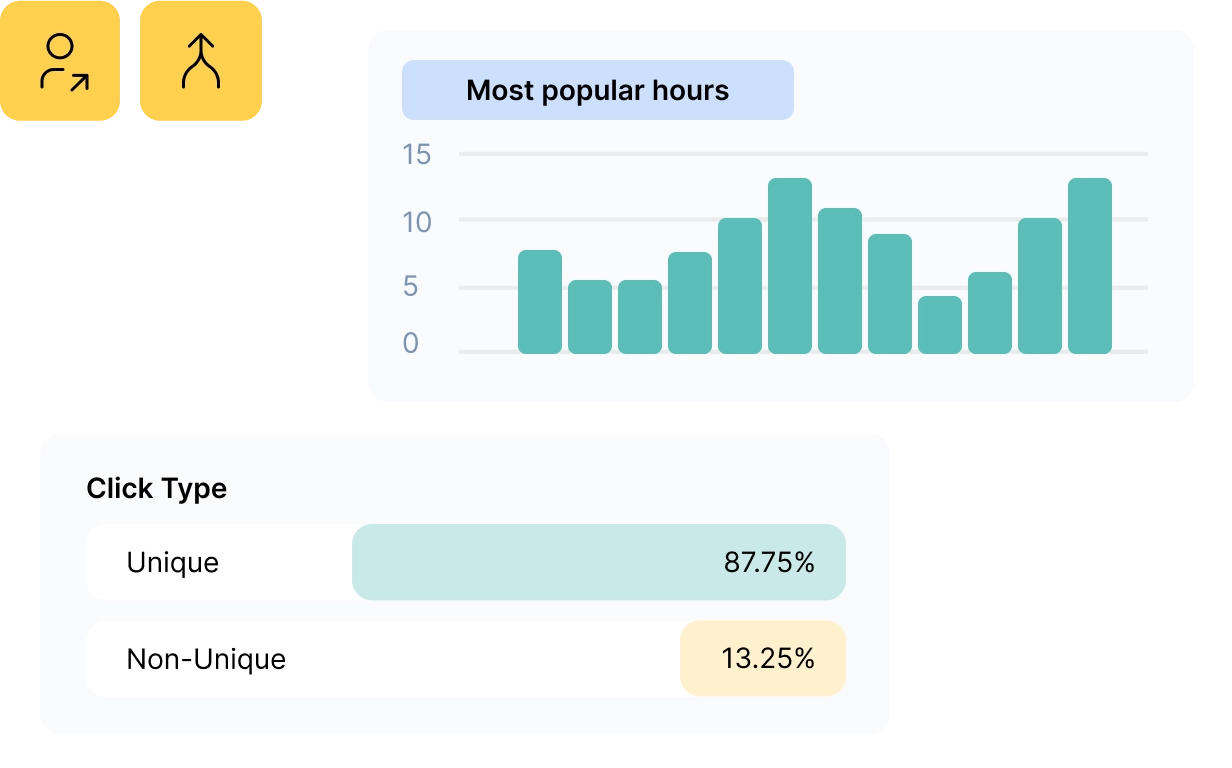
Learn more about your audience with instant visibility into location, device type, and browser information.
Distinguish between QR code scans and direct link clicks to optimize your content strategy.
Make data-driven decisions with confidence
Monitor campaign performance with analytics that reveal audience behavior and engagement patterns.
Tailor your analytics set-up to focus on the metrics that matter most to your business.
Save time with scheduled analytics reports sent that keep your entire team aligned on performance.
Demonstrate measurable impact
Easily interpret your data with intuitive charts and graphs that bring your metrics to life.
Collaborate with your team by sharing analytics reports securely, fostering data-driven decision-making.
Base campaign improvements on verified audience behavior and engagement patterns.
See what our customers say
“Rebrandly is the best. They create a crazy amount of volume with the highest deliverability and performance – more than a million links in a minute.”
“Rebrandly makes it super easy to create short links for the whole team. Before we used Bitly but that coordination was a nightmare. Now we have all our links in one place which also looks amazing.”
“Our URLs are long and people love to add UTMs, so branded links are much clearer for our marketing materials.”
“We chose Rebrandly for its powerful analytics capabilities. We use the platform to share our journalism solutions and training materials with newsrooms worldwide.”
“Rebrandly empowers us to keep tabs on our campaign performance worldwide.”
“Brand affinity is a unicorn for improving trust, click-through-rate and conversions. Rebrandly’s industry-leading tools help marketers brand and manage links for performance boosts across the funnel.”

“Having a short, easily intuitive link is powerful for us.”


Frequently asked questions
What analytics data can I access with Rebrandly?
Rebrandly provides comprehensive analytics, including total clicks, geographic data down to city level, device types, browsers, operating systems, languages, referral sources, and timing patterns. You can track both direct link clicks and QR code scans separately to understand how your audience prefers to engage.
What's the difference between Basic and Advanced reporting?
Basic reporting (available on free plans) shows total clicks, geographic distribution by country, and time-based breakdowns by hours, days, and months. Advanced reporting (paid plans) adds click types, top devices, languages, browsers, social platforms, and operating systems. Professional plans and above get additional insights like aggregated reporting across your account.
Can I see which cities my clicks are coming from?
Yes. Rebrandly offers city and state-level analytics, giving you precise geographic insights beyond just country data. This helps you understand regional engagement patterns and optimize campaigns for specific locations.
Can I distinguish between QR code scans and direct link clicks?
Yes. Rebrandly analytics clearly separate QR code interactions from direct link clicks, so you can understand which access methods your audience prefers and optimize your campaigns accordingly.
Can I export my analytics data?
Enterprise users can create custom reports with specific data points and download them as files. Rebrandly also offers a robust API for integrating analytics data with other marketing tools and platforms like Snowflake, AWS, Tableau, and Google Cloud.
What reporting options are available for teams?
Professional plans and above include aggregated reporting that can be filtered by workspaces, teammates, domains, tags, and trending links. Enterprise plans offer custom report building with automated delivery schedules to keep your team aligned on performance metrics.
Do I own my analytics data?
Yes. With Rebrandly, you own all your analytics data. Every click, view, and engagement metric belongs to you, giving you complete control over your marketing insights and data retention
What timezone are the reports displayed in?
All Rebrandly analytics reports use UTC (Coordinated Universal Time) as the standard timezone. Custom reports can be configured to use your preferred timezone for easier interpretation.
How far back does historical data go?
Rebrandly maintains your historical analytics data, allowing you to analyze trends and performance over time. The exact retention period depends on your plan level, with Enterprise plans offering the most comprehensive data retention.
Can I integrate Rebrandly analytics with other tools?
Yes. Rebrandly integrates with 100+ platforms and offers a comprehensive API for connecting with your existing marketing stack. Enterprise plans provide advanced API access for custom analytics solutions and automated data collection.
Does Rebrandly support webhooks for real-time data streaming?
Yes. Professional and Enterprise plans include webhook functionality that streams click events directly to your existing systems within seconds. You can connect up to 100 endpoints and send rich event data, including location, device type, referrer information, timestamps, and UTM parameters to platforms like Google Analytics, Segment, HubSpot, or any system with an HTTP endpoint.

Follow us


Download the app


