agencies
Supercharged links for modern campaigns
Digital transformation for agencies, all in one place.
Join agencies who love Rebrandly

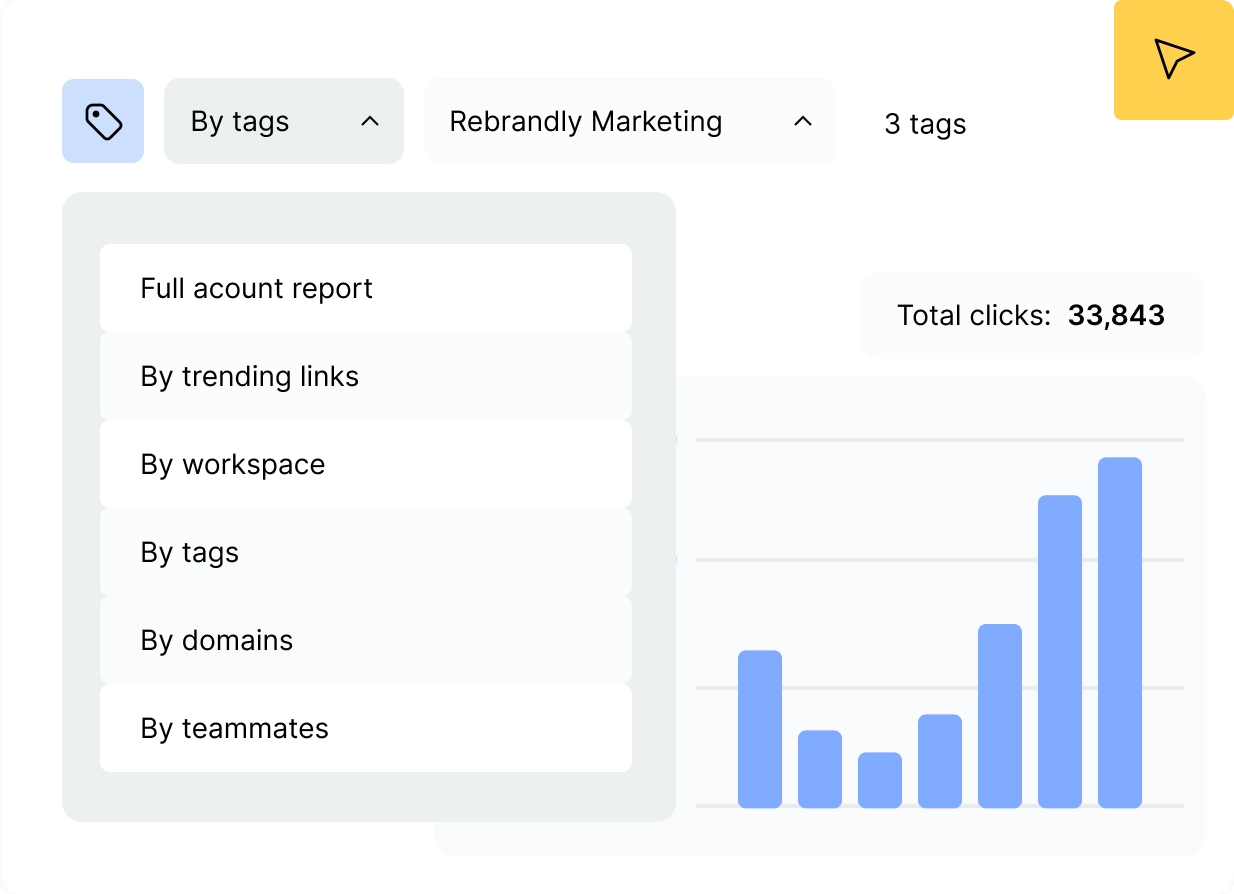
Track performance across every channel
Craft branded links for each client, elevating their brand with every click.
Redirect and bulk-edit links effortlessly across channels.
Free up your team’s time by reducing tedious, repetitive tasks.
Seamless collaboration for every stakeholder
Role-based permissions keep data secure and client-friendly.
Clean and useful insights keep clients informed.
Smooth approvals mean no more bottlenecks.
Audience insights
Learn who is interacting with your links based on location, device type and language.
Prove value with in-depth metrics
See email, social, paid, and organic performance in one place.
Set parameters once at the workspace level. Never miss tracking data or deal with inconsistent codes again.
AI-powered decision making automatically applies insights to improve engagement.

Follow us


Download the app


